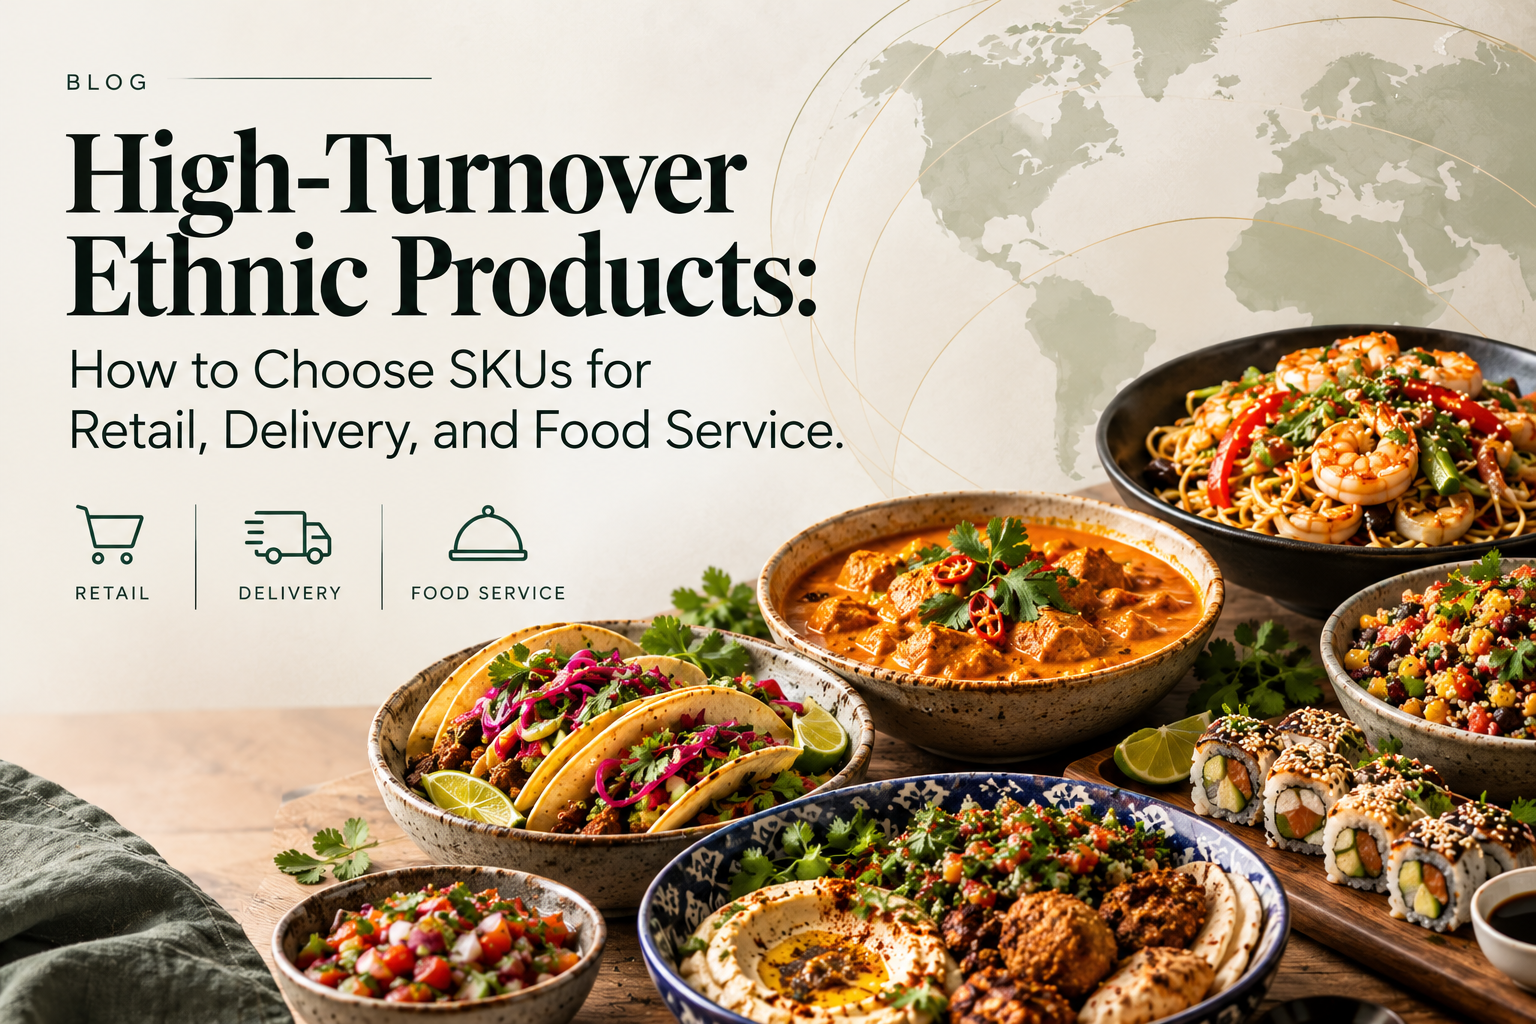
There is no universal high-turnover SKU. The right product depends on the sales channel, replenishment frequency, convenience of use, consumer familiarity, and the product’s ability to drive complementary purchases. For distributors, grocery stores, and food service operators working with ethnic products in the U.S. market, this distinction is the difference between a profitable mix and dead stock.
The landscape is favorable: Hispanic consumers represent 20.5% of the U.S. population — approximately 70 million people — and are a significant driver of CPG and food growth. At the same time, global flavors are moving beyond cultural niches into mainstream supermarkets, restaurant menus, frozen foods, snacks, and beverages nationwide.
Three Key Numbers Backing This Strategy
1. Hispanic consumers are outspending their population share. Hispanic households represent 14% of all U.S. households but drive 16% of total CPG growth. In addition, Hispanic CPG spending grew 3.5% (compared to 2.6% among non-Hispanic consumers), and unit growth reached 7%, while the non-Hispanic group saw a 0.3% decline. This means high-turnover ethnic products should not be treated as a secondary category — they represent a real volume growth opportunity.
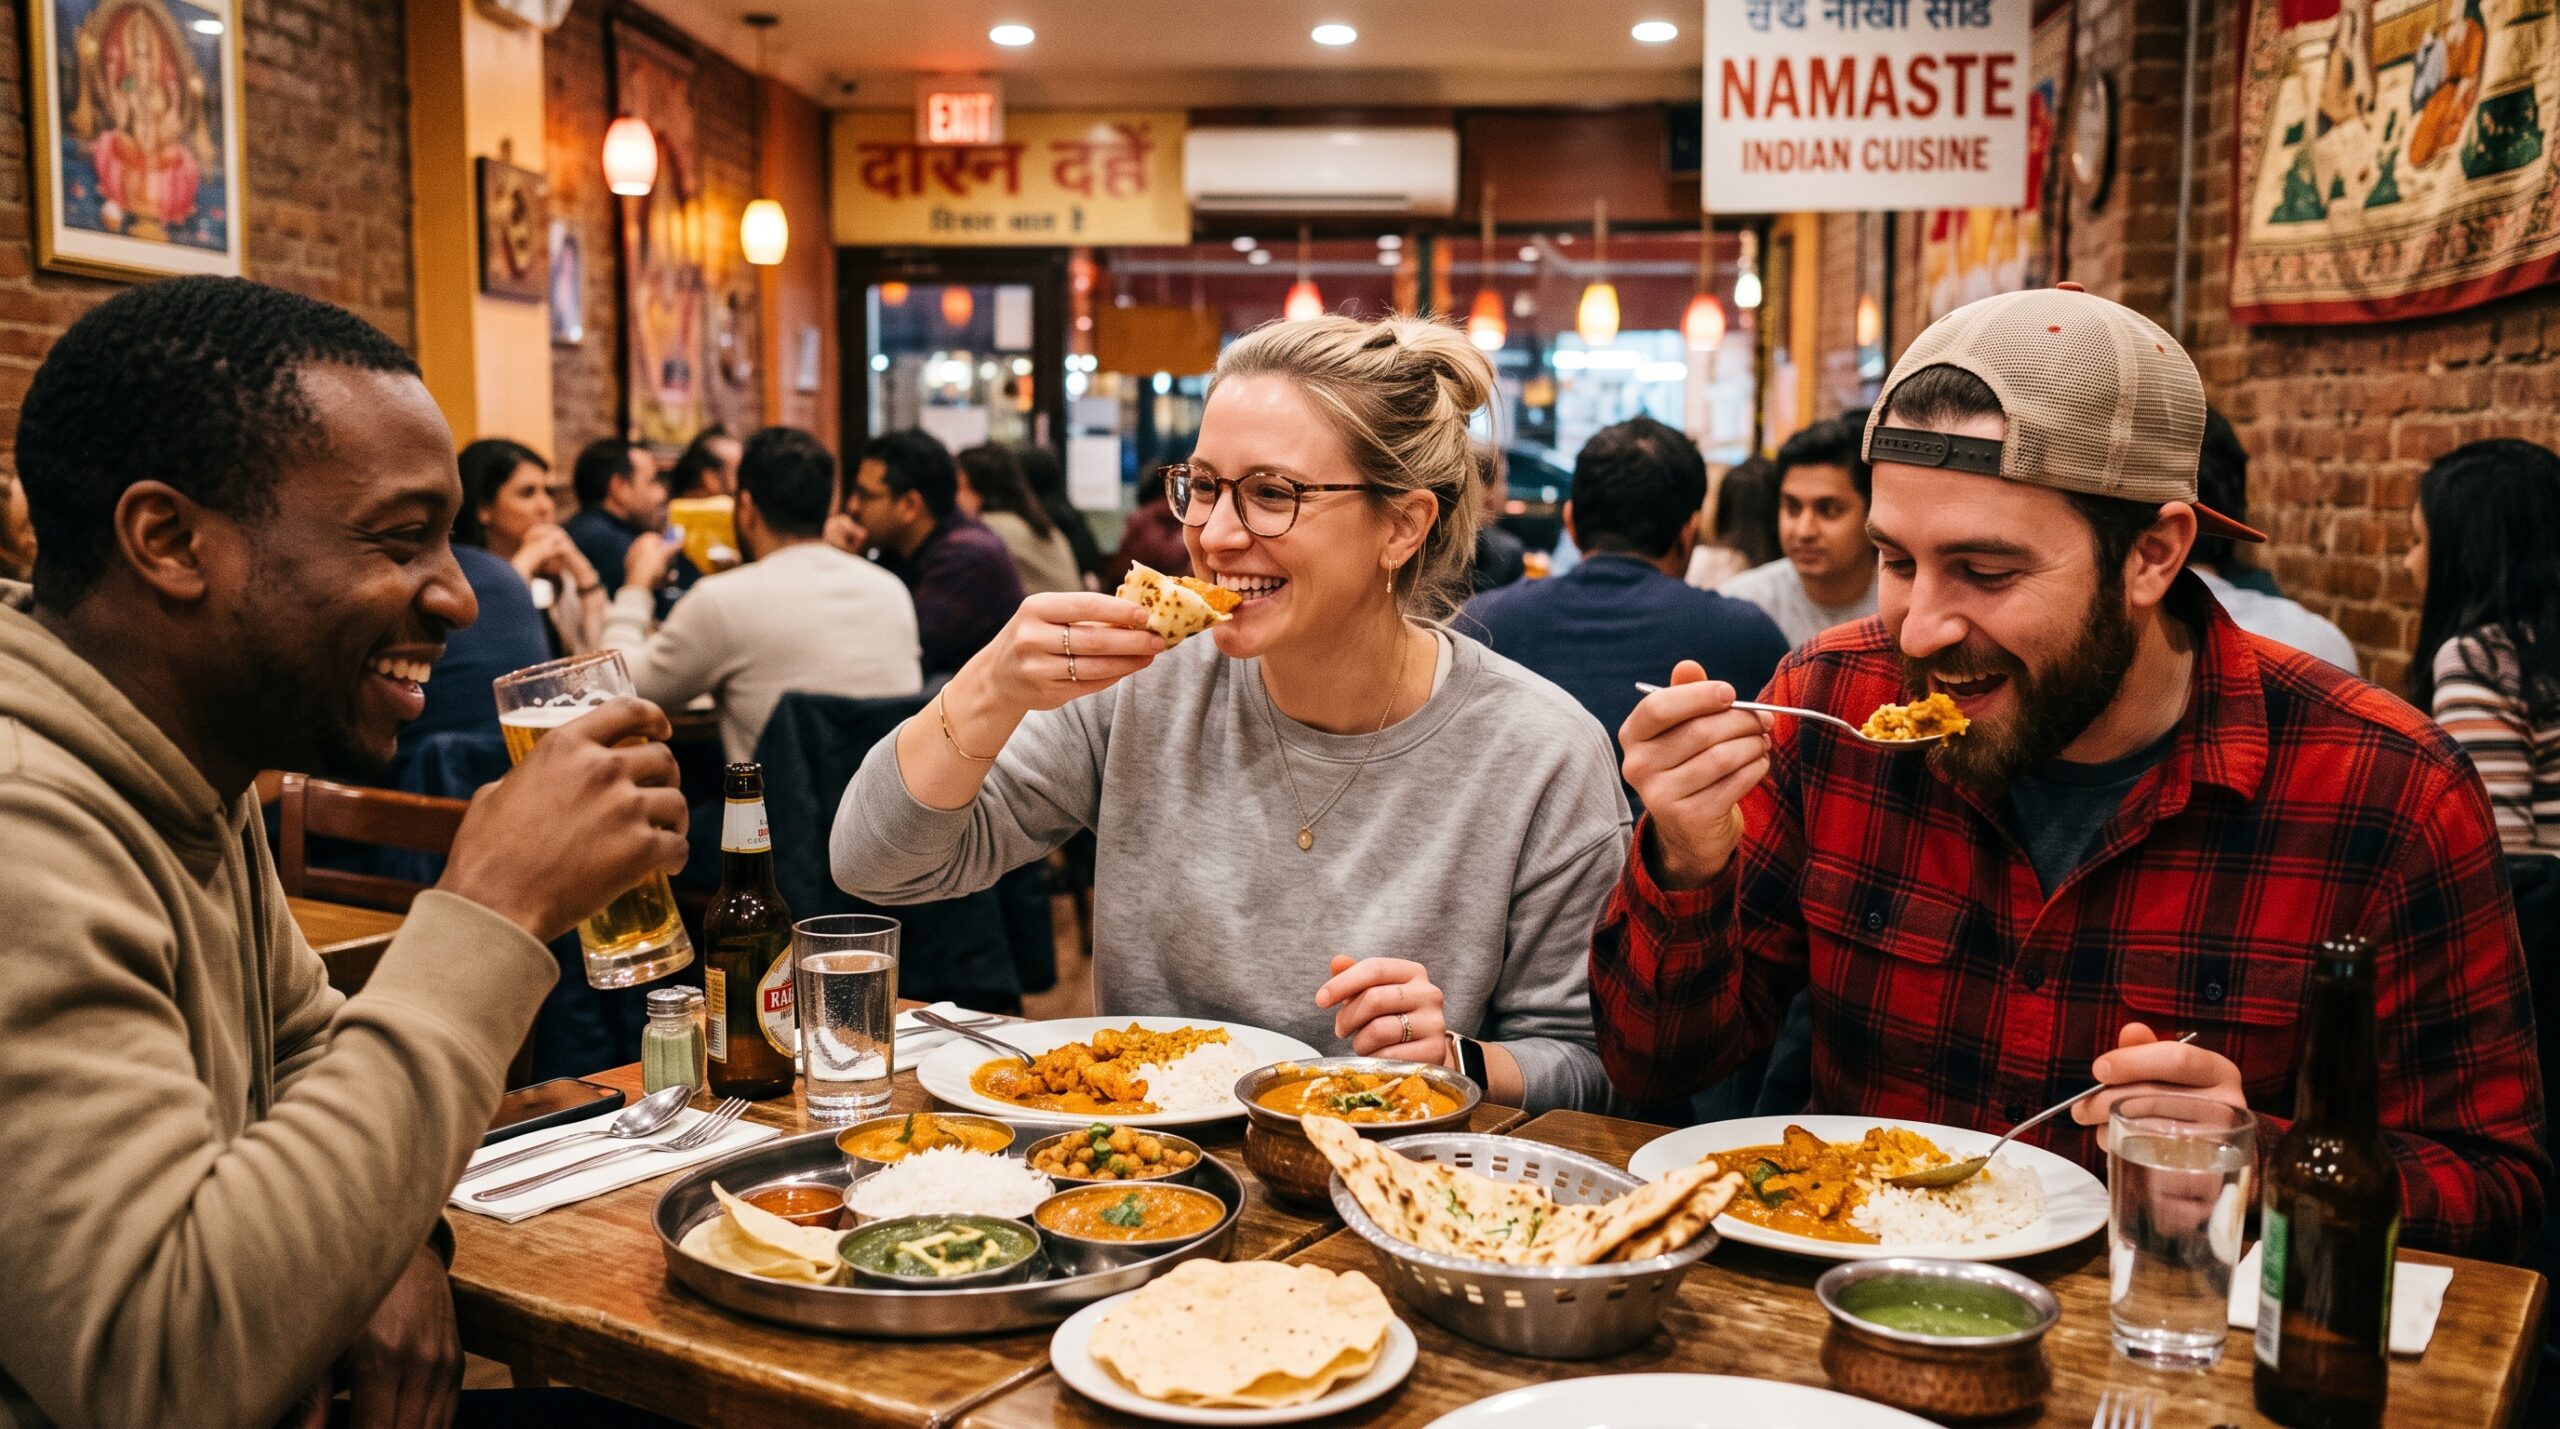
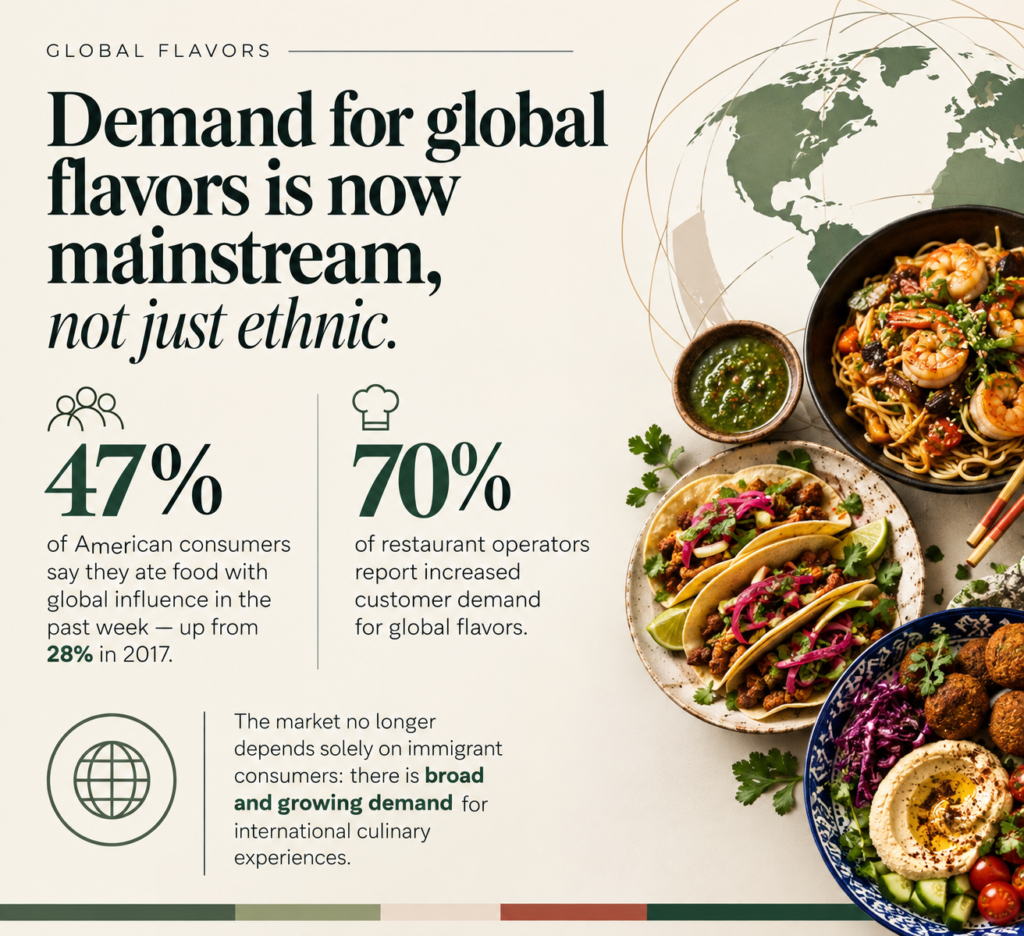
2. Demand for global flavors is now mainstream, not just ethnic. 47% of American consumers say they ate food with global influence in the past week — up from 28% in 2017. And 70% of restaurant operators report increased customer demand for global flavors. The market no longer depends solely on immigrant consumers: there is broad and growing demand for international culinary experiences.
3. Food service is an essential channel for this strategy. Total U.S. food spending reached $2.51 trillion in 2025, with $1.41 trillion (56.3% of the total) spent away from home. The restaurant industry projected $1.5 trillion in sales and 15.9 million jobs that same year — and half of operators say off-premises sales (delivery/takeout) now represent a larger share of revenue than in 2019.
What Actually Defines a “High-Turnover” SKU
The core recommendation is simple: don’t label a SKU “high-turnover” just because it’s popular. High turnover must be validated with real sales and operational data — inventory turnover rate, sell-through, gross margin, GMROI, stockout rate, and waste.
A high-turnover ethnic product isn’t just one that sells a lot. It’s one that sells consistently, maintains sustainable margins, has predictable replenishment, generates low waste, and contributes to increasing the customer’s basket value.
Priorities by Channel
Retail and Grocery Stores
Turnover comes from the combination of recurrence, familiarity, and discovery: pantry staples (rice, beans, flours, seasonings), breakfast items, easy-prep frozen foods, and impulse-buy snacks. Hispanic consumers prefer in-store shopping, value brands from their countries of origin, and gravitate toward value and volume-oriented channels — a data point that should directly shape shelf mix decisions.
Delivery and Takeout
Here the criteria shift: the product must be standardizable, quick to prepare, easy to portion, and stable through delivery. Consistent bases (sauces, seasoning mixes, condiments), pre-portioned frozen items, and packaging resistant to leakage or texture loss are the priority. Always ask: does the product maintain quality after 20-40 minutes in transit?
Food Service and Restaurants
The winning SKU is one that reduces operational complexity and serves multiple dishes at once — a sauce, seasoning, or culinary base that appears across different menu items. Cross-utility ingredients and pre-portioned food-service-sized formats drive greater kitchen efficiency and better cost control.
Avoid Generic Promises
Three claims to avoid when building any ethnic SKU strategy:
- “These are the best-selling SKUs in the U.S.” — there is no reliable public ranking by channel and origin.
- “Ethnic products always have higher margins” — margin depends on landed cost, freight, shrinkage, and price competitiveness.
- “Every ethnic product works across all channels” — an item that succeeds in food service may underperform in retail, and vice versa.
Final Recommendation
Start with a lean mix, track turnover, margin, stockouts, and waste for 60 to 90 days, and only then increase inventory depth for validated winners. This approach works for small markets, supermarkets, restaurants, delivery kitchens, and food service buyers alike — without promising universal results the data can’t support.
Sources
- U.S. Census Bureau. “QuickFacts: United States — Race and Hispanic Origin.” 2025. https://www.census.gov/quickfacts/fact/table/US/RHI725225
- Circana. “Retail and Brand Strategies for Reaching Hispanic Food and Beverage Shoppers.” 2025. https://www.circana.com/post/retail-and-brand-strategies-for-reaching-hispanic-food-and-beverage-shoppers
- Circana. “Hispanic Consumer Data.” Insights Hub, 2025. https://www.circana.com/insights-hub/hispanic-consumer-data
- U.S. Department of Agriculture, Economic Research Service (USDA ERS). “U.S. Food Spending in 2025.” Charts of Note. https://www.ers.usda.gov/data-products/charts-of-note/114212
- National Restaurant Association. “State of the Restaurant Industry 2025.” https://go.restaurant.org/rs/078-ZLA-461/images/SOI-2025-Report.pdf?version=0
- PR Newswire. “Restaurant Industry Poised for Growth in 2025: Industry Expected to Employ 15.9 Million People and Reach $1.5 Trillion in Sales.” 2025. https://www.prnewswire.com/news-releases/restaurant-industry-poised-for-growth-in-2025-industry-expected-to-employ-15-9-million-people-and-reach-1-5-trillion-in-sales-302369638.html
- NielsenIQ (NIQ). “Summer Fancy Food Show 2025 Trends.” 2025. https://nielseniq.com/global/en/insights/analysis/2025/summer-fancy-food-2025/
- Innova Market Insights. “US Flavor Trends: Consumer Insights and Preferences.” 2025. https://www.innovamarketinsights.com/trends/us-flavor-trends-consumer-insights-and-preferences/
- Datassential. “Global Flavors and Restaurant Growth 2025.” https://datassential.com/resource/global-flavors-restaurants-growth-2025/
- Datassential. “Food and Beverage Trends 2025.” https://datassential.com/resource/food-and-beverage-trends-2025/
- Datassential. “Menu Trends Strategy.” https://datassential.com/resource/menu-trends-strategy/
- NAMA (National Automatic Merchandising Association). “Flavor Trends 2025.” https://namanow.org/flavor-trends-2025/
- Grande Cig. “Taste and Texture Trends in Food Formulation.” https://www.grandecig.com/blog/taste-and-texture-trends-in-food-formulation